A stained tissue slide holds a considerable amount of information: several hundred thousand cells, their positions, their markers, their organization. The pathologist extracts a diagnosis from it, often with remarkable acuity. But when the task is no longer to recognize but to measure — how many lymphocytes per square millimeter, in which region, above or below which threshold — visual examination meets a limit that has nothing to do with the observer’s competence.
It is that gap digital pathology fills. By digitizing the whole slide and then applying image analysis, an appraisal is turned into a reproducible measurement. This article sets out what that transformation brings, through a study that quantifies precisely what is at stake, what it demands technically, and the limits it would be imprudent to ignore.
What human examination does well, and what it does badly
The division of labor has to be stated at the outset, or the argument will be misread.
Human examination excels at recognizing complex patterns: identifying a tumor architecture, spotting an unexpected anomaly, judging an atypical case, integrating the patient’s clinical context. These operations draw on experience and a capacity for interpretation that no algorithm reproduces today.
The human eye, on the other hand, is poorly equipped to count. Visually estimating a cell density, converting it into a category, applying a threshold identically from one observer to the next and from one day to the next: these are tasks where human performance plateaus, not for want of knowledge, but because semi-quantitative visual estimation is not a measuring instrument. No one would ask an expert eye to weigh a sample.
The question is therefore not who does better, but recognizing that two different tasks call for two different tools.
The decisive case: measuring the gap between eye and machine
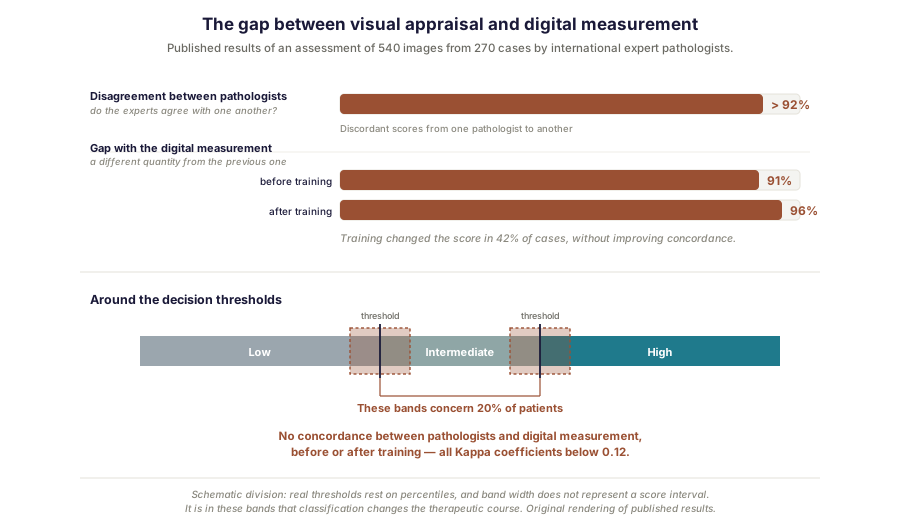
That gap has been quantified, and the result is starker than one might expect. A study Inovarion contributed to presented an international group of expert pathologists with 540 images from 270 colon cancer cases stained for CD3+ and CD8+ T lymphocytes, asking them to assess the infiltrate visually as a score, then comparing their assessments with one another and with the reference digital quantification [4].
The findings read in order of increasing severity.
First, the pathologists do not agree with one another: discordant scores were reported in more than 92% of cases. Next, the gap with the digital reference reaches 91% of cases. A training session was then held, and this is the most instructive result: it changed the score in 42% of cases without improving concordance, which was even measured at 96% disagreement after training. In other words, more training does not solve the problem. The most economical reading is that the problem lies not in the observers’ competence but in the assessment modality itself — without ruling out other explanations, such as an insufficiently precise definition of the task. It is worth noting that the remedy is the same either way: replacing a semi-quantitative visual judgment with an explicitly defined digital measurement.
The most decisive point concerns patients around the decision thresholds. For that 20% of cases, precisely those where classification changes the therapeutic course, no concordance was observed between the pathologists and the digital analysis, either before or after training, with Kappa coefficients all below 0.12. The authors’ conclusion is unambiguous: the standardized test outperformed visual scoring by expert pathologists in a clinical setting.
It matters to read carefully what this study establishes. It does not say that pathologists are wrong, nor that they are dispensable. It establishes that, for this task and in this setting, semi-quantitative visual estimation does not reach the reproducibility a threshold-based decision requires, which points to a property of the method, not of the people.
What reliable quantification demands
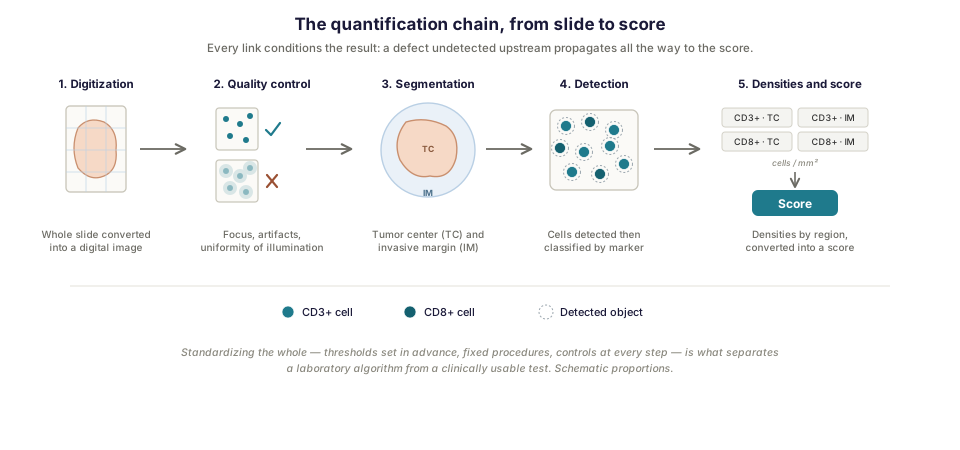
Obtaining a reproducible measurement presupposes a complete technical chain, each link of which conditions the result.
The slide is first digitized in its entirety, producing a very large image. Then comes quality control of that image (focus, absence of artifacts, uniformity of illumination), a step readily neglected even though a defect undetected here propagates silently through everything that follows. Next comes segmentation of the regions of interest: in the case of the tumor immune infiltrate, distinguishing the tumor center from its invasive margin, two compartments whose biological meaning differs, as we develop in relation to the immune microenvironment. Then come cell detection, their classification according to the markers expressed, the calculation of densities by region, and finally conversion into a score.
Standardization, the condition of clinical use
An algorithm that works in one laboratory is not a test. What makes the difference comes down to a few requirements: thresholds defined in advance and not adjusted afterward, fixed and documented procedures, controls at every step, and above all multicenter validation.
That is the point of a second study Inovarion contributed to, conducted under the auspices of the Society for Immunotherapy of Cancer on stage III colon cancer [5]: an international multicenter design in which the test must produce consistent results across different sites, with their own equipment, staining protocols and operators. A result reproducible in a single center establishes internal reproducibility, which is necessary but not sufficient: it is concordance across centers that qualifies a test for clinical use.
From image analysis to deep learning
These two approaches do not follow the same logic, and conflating them leads to poorly calibrated expectations.
Classical image analysis rests on explicit rules written by the designer: intensity thresholding, morphological criteria, filtering operations. It is transparent, inspectable, and well suited to tasks where the rule can be formulated — detecting a stained nucleus, measuring an area.
Deep learning proceeds differently: the rules are not written but learned from annotated data. This approach wins where the explicit rule fails, notably on textures, tissue architectures and heterogeneous cases. Algorithms developed in this framework reach performance comparable to that of trained pathologists for tasks such as detection or tumor grading. But a reference review sets down a finding worth keeping in mind: despite these promising results, very few algorithms have reached clinical implementation, which sets hope against hype [1].
The field has recently seen a notable development with foundation models: large models pre-trained in a self-supervised way on vast collections of histology images, then adapted to specific tasks [2]. The benefit is to reduce the volume of annotation needed for each new application, most of the learning having been done upstream.
Limits and pitfalls
Several sources of error precede the analysis and condition it.
The first is pre-analytical variability: duration and type of fixation, section thickness, antibody lot, staining protocol. It sets in before any digitization, and no analysis, however sophisticated, corrects it retrospectively. Then comes acquisition variability (scanners from different manufacturers, distinct color calibrations), then batch effects and drift over time when a series is processed across several months.
A more recently documented limit is easy to overlook. Despite a growing number of regulatory clearances, deep-learning-based computational pathology systems often neglect the effect of demographic factors on their performance — all the more so as the large public datasets they train on under-represent certain groups. Whole-slide classification models thus show marked performance gaps across demographic groups, on tasks as varied as subtyping breast and lung carcinomas or predicting IDH1 mutations in gliomas; and while richer representations, drawn from self-supervised foundation models, reduce these gaps, they correct them only partially [3]. A model validated on one population is therefore not automatically valid on another.
From these findings follows a simple requirement: validation must be done on independent cohorts, with performance criteria defined in advance, and explicit attention to the composition of the training and test populations.
What quantification opens up
The value of image analysis is not confined to automating an existing count. By making the measurement reproducible, it makes possible readings that were not conceivable before.
Multiplexing allows many markers to be quantified simultaneously on the same section, and therefore the balance between cell populations to be assessed rather than their abundance in isolation. Location opens up the analysis of neighborhood relations: which cells sit next to which others, at what distance. And the image becomes a layer of information that can be articulated with other modalities — exactly the articulation achieved by spatial transcriptomics, which we treat elsewhere, by superimposing molecular map and histology from the same section.
How Inovarion can support you
Inovarion covers the full chain of quantitative image analysis: algorithm design and development, including by deep learning, qualification and validation of pipelines, quality control of images and data, and articulation of imaging results with molecular data. Our teams have contributed to reference work on the standardized quantification of the tumor immune infiltrate, including the international multicenter studies that tested these assays across several sites. The challenge, in every project, is the same: that the measurement produced be both accurate and reproducible — because a threshold-based decision requires both, and reproducibility is the one most often neglected.
Publications
Field references
- van der Laak J, Litjens G, Ciompi F. Deep learning in histopathology: the path to the clinic. Nature Medicine, 2021;27(5):775-784. PubMed
- Chen RJ, et al. Towards a general-purpose foundation model for computational pathology. Nature Medicine, 2024;30(3):850-862. DOI
- Vaidya A, Chen RJ, Williamson DFK, et al. Demographic bias in misdiagnosis by computational pathology models. Nature Medicine, 2024;30(4):1174-1190. PubMed
Inovarion contributions
- Willis J, Anders RA, Torigoe T, et al. Multi-Institutional Evaluation of Pathologists’ Assessment Compared to Immunoscore. Cancers, 2023;15(16):4045. Record → · PubMed
- Mlecnik B, et al. Multicenter International Society for Immunotherapy of Cancer Study of the Consensus Immunoscore for the Prediction of Survival and Response to Chemotherapy in Stage III Colon Cancer. Journal of Clinical Oncology, 2020;38(31):3638-3651. Record → · PubMed
updated July 2026