Measuring gene expression in a tissue almost always entails giving something up. Classical RNA sequencing grinds up the sample and yields an average; single-cell sequencing dissociates the tissue to analyze cells one by one, and thereby loses the information that says where each of them was. Yet a tissue is not a bag of cells: it is an architecture, made of gradients, neighborhoods, fronts and niches. Spatial transcriptomics was designed to lift precisely that renunciation — measuring expression without erasing the geography.
This article sets out the principle of these methods, the trade-offs they impose, and above all what they concretely bring, through two pieces of work Inovarion contributed to: mapping epileptogenesis in an animal model, and analyzing muscle biopsies from children with juvenile dermatomyositis. In both cases, the spatial reading produced a result no other approach would have given.
What position adds
The observation that motivated the development of these techniques is simple: current methods of transcriptome analysis lose positional information, and many of them require laborious cell isolation [1]. One is therefore faced with a frustrating alternative: either an average that ignores heterogeneity, or a catalog of cells detached from their context.
That loss is not trivial, because many biological questions are by nature spatial. Knowing that a tissue contains inflammatory cells does not say whether they are massed at the periphery or infiltrated into the heart of the lesion — a distinction we have seen to be decisive in immuno-oncology. Knowing that an injured brain expresses markers of glial activation does not say which regions are affected. And a heterogeneous muscle biopsy can give opposite results depending on where the sample is taken. In such situations, position is not an ornament of the data: it is a constitutive dimension of it.
This is the direct extension of the question we addressed in relation to the choice between single-cell and bulk sequencing: single-cell reveals who is there, spatial transcriptomics reveals where.
The principle: barcodes that carry an address
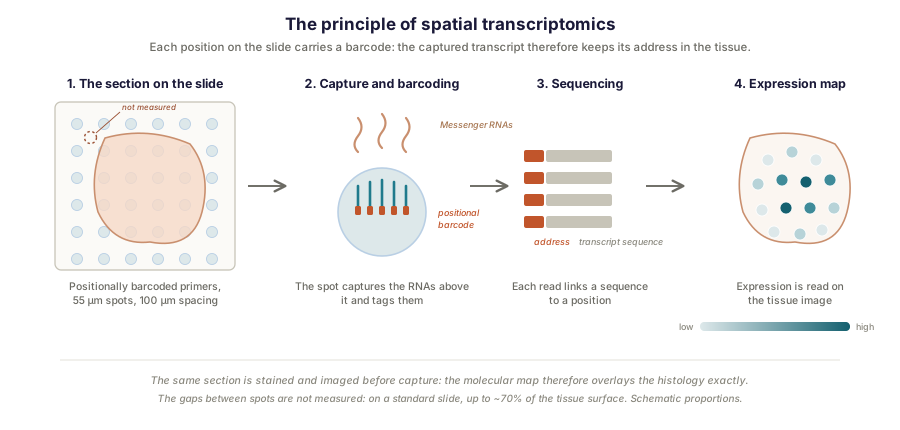
The founding idea, published in Science in 2016, has a mechanical elegance. A histological section is placed on a slide covered with an array of reverse transcription primers, each position of the array carrying a unique positional barcode. Messenger RNAs from the section hybridize to the primers lying immediately beneath them; reverse transcription then incorporates the positional barcode into the complementary DNA produced. After sequencing, computational reconstruction restores to each transcript its coordinates of origin — one obtains high-quality sequencing data while preserving two-dimensional positional information [1].
One of the practical benefits of this approach is that the same section can be stained and imaged before capture. The expression map is then superimposed on the histology: the molecular data is literally inscribed on the image of the tissue, and pathologist and biologist alike find their anatomical landmarks there.
Two families of methods, two trade-offs
Since that founding publication, the field has expanded rapidly, carried by joint advances in sequencing, oligonucleotide synthesis and fluorescence microscopy — with continuous gains in sensitivity, multiplexing and throughput [2]. Two broad families have emerged, which do not impose the same trade-off.
Sequencing-based approaches extend the original principle: the tissue is placed on a surface structured into coded positions, and what has been captured is sequenced. This is the family of Visium (10x Genomics), the most widespread, along with Slide-seq and Stereo-seq. Their strength is the absence of prior assumptions — the whole transcriptome is measured, without having to decide in advance which genes to observe, which allows discovery. Their historical limit was resolution: a Visium capture position measures 55 micrometers, a surface covering several cells. That limit is nevertheless receding fast — recent versions go down to a few micrometers for Visium HD, and as far as the submicrometer scale for Stereo-seq. In return, the capture efficiency of these approaches remains modest: Slide-seqV2, for instance, reaches about 44% of that of droplet-based single-cell sequencing, which penalizes low-abundance transcripts.
Imaging-based approaches proceed in the opposite way. They detect RNA molecules directly in the tissue, through cycles of fluorescent probe hybridization and microscopic reading. This family includes MERFISH, commercialized under the name MERSCOPE by Vizgen, as well as the Xenium (10x Genomics) and CosMx (NanoString, Bruker group) platforms. Resolution is cellular to subcellular, and detection efficiency markedly better, on the order of 80% within the panel. But it is that panel that has to be chosen upstream: coverage is targeted, never exhaustive.
The fundamental trade-off therefore remains, even though the sliders are moving fast: exhaustive coverage of the transcriptome on one side, resolution and sensitivity on the other. The choice is made, as always, according to the question — exploration without a prior hypothesis, or precise quantification of an already identified set of markers.
The hard point: a spot is not a cell
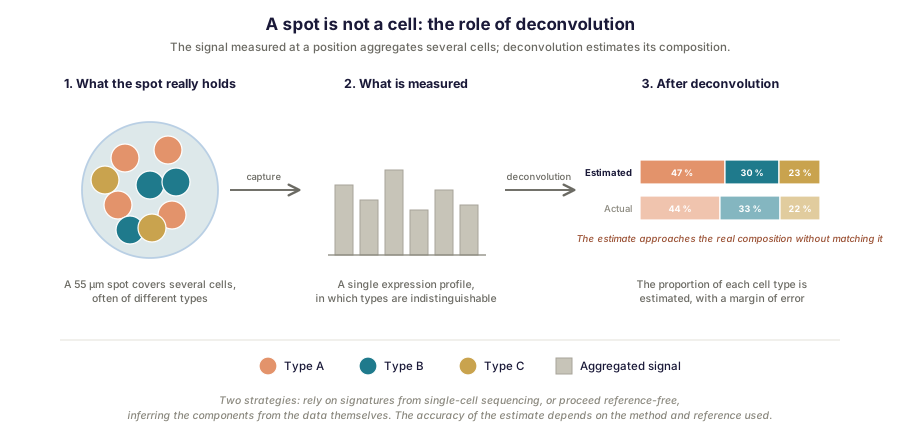
This is the limit to understand before designing a study, since it conditions interpretation. In classical sequencing-based approaches, each capture position — commonly called a spot — aggregates transcripts from several cells, on the order of a few up to about ten depending on tissue density, and often of different types. The signal measured at a point is therefore a mixture, not the profile of a cell.
Hence the importance of deconvolution: estimating, for each spot, the proportions of the different cell types contributing to it. Two strategies exist. The most widespread relies on expression signatures established by single-cell sequencing, which serve as a reference for decomposing the mixture [3]. The other, termed reference-free, proceeds in an unsupervised way and infers the components directly from the data — an approach particularly useful when no relevant single-cell atlas exists for the tissue or pathology studied, as we shall see in the second case.
Other limits are worth knowing, and the first is rarely stressed. On a standard Visium slide, the 55-micrometer spots are separated by a 100-micrometer center-to-center spacing: they therefore leave gaps between them where nothing is measured, amounting to as much as about 70% of the section’s surface. Only a fraction of the tissue is thus sampled, and this is one of the major contributions of continuous grids such as that of Visium HD, which remove these gaps as much as they refine resolution. Lateral diffusion of RNA molecules during capture moreover degrades the effective resolution, which always remains somewhat poorer than the slide’s nominal resolution. Finally, RNA quality in the tissue constitutes a first-order constraint, particularly on fixed material — this point often conditions the very feasibility of a project. These constraints are documented and discussed in the field’s methodological reviews [2]; ignoring them leads to overinterpretation.
First case: mapping epileptogenesis beyond the hippocampus
Temporal lobe epilepsy is classically associated with hippocampal sclerosis, and the hippocampus has long concentrated the attention of researchers and clinicians alike. One question nevertheless remained open: does the tissue reorganization that leads to epilepsy really confine itself to that region? Answering it meant being able to observe several brain structures at the same time — which no dissociative method allows.
Work Inovarion contributed to approached the question through spatial transcriptomics [4]. The design rests on a model of status epilepticus induced by lithium-pilocarpine in the rat, known to reproduce the sequence leading to epilepsy: an initial insult, then a silent latent phase, during which the tissue reorganizes, before spontaneous seizures appear. It is that latent phase, the window of epileptogenesis, that is of interest — it is there that the fate of the injured brain is decided. Coronal brain sections from treated and control animals were analyzed by Visium spatial transcriptomics, to map transcriptional dynamics over time.
The result shifts the boundary of the disease. Microglial activation and reactive astrogliosis do not remain confined to the hippocampus: they extend well beyond it, encompassing white matter tracts and several thalamic nuclei, and do so as early as the latent phase. In other words, while the animal is still showing no seizures, a glial reaction is already under way in regions that were not implicated.
This result illustrates well why the method was necessary. Bulk sequencing of hippocampus would, by construction, have ignored the thalamus. Single-cell sequencing after dissociation would have identified activated microglia, but without being able to say which region they came from — and that is exactly the information that makes the discovery. Only a method preserving geography could show that the glial response is regionally structured.
This case also illustrates an articulation we develop in relation to preclinical models: the value of a preclinical model depends closely on how finely one is able to read it.
Second case: a signature that persists after remission
Juvenile dermatomyositis is a rare inflammatory myopathy of childhood, affecting muscle and skin. Treatment often achieves clinical remission — muscle strength is restored, biological markers normalize. A fundamental question nevertheless remains, and it has practical consequences for how treatment is conducted: does this clinical remission correspond to a normalization of the muscle tissue itself?
A second piece of work addressed this question by combining spatial transcriptomics, unsupervised reference-free deconvolution and standardized morphometry, on muscle biopsies taken before and after treatment [5]. The reference-free approach is of notable methodological interest here: it infers the cellular components from the data themselves, without imposing on the tissue categories established elsewhere — an asset when exploring a pathological context for which reference atlases are scarce.
The study draws two results from this. The first is the heterogeneity of profiles within the muscle: not all zones resemble one another, which has an immediate methodological implication — a single biopsy, or a bulk analysis of the sample, can give a misleading picture depending on the area examined. Here again, in an entirely different context, is the lesson we drew from the analysis of metastases: averaging a heterogeneous reality erases the very thing being sought.
The second result is more striking still: an abnormal signature persists after remission. Where the clinical picture has normalized, the tissue retains a molecular trace of the disease. The finding invites a distinction between clinical remission and tissue normalization, and opens the still-unsettled question of the prognostic significance of that persistence.
What it takes to make it work
Experience of these projects brings out a few decisive requirements, almost all of them upstream of sequencing.
The first is RNA quality. Spatial transcriptomics on degraded tissue produces unusable data, and this constraint must be assessed before committing to a project, particularly on archival material. Then come section preparation (thickness, flatness, absence of folds) and, in the case of structured tissues such as brain, anatomical orientation: a spatial map makes sense only if one knows, with certainty, which structures the regions observed correspond to.
Downstream, the analytical chain is substantial: quality control, normalization, identification of spatial domains, deconvolution, cell type annotation, and systematic confrontation with the histology of the same section. That last step is the one most readily neglected, and yet it is what distinguishes an interpretable map from a pretty color gradient. As with the other high-throughput approaches, the value of the result is decided as much at design and analysis as at the bench.
How Inovarion can support you
Inovarion supports spatial transcriptomics projects, from study design to interpretation of results: feasibility assessment according to the nature and quality of the material, choice of approach in light of the question posed, execution, then bioinformatic analysis — identification of spatial domains, deconvolution with or without a reference, integration with single-cell data and with histology. Our teams have contributed to work applying these methods in neuroinflammation and inflammatory myopathy, and articulate this expertise with work on preclinical models and quantitative image analysis.
Publications
Field references
- Ståhl PL, Salmén F, Vickovic S, et al. Visualization and analysis of gene expression in tissue sections by spatial transcriptomics. Science, 2016;353(6294):78-82. DOI
- Tian L, Chen F, Macosko EZ. The expanding vistas of spatial transcriptomics. Nature Biotechnology, 2023;41(6):773-782. PubMed
- Newman AM, et al. Determining cell type abundance and expression from bulk tissues with digital cytometry. Nature Biotechnology, 2019;37(7):773-782. PubMed
Inovarion contributions
- Dufour A, et al. Spatiotemporal transcriptomic mapping reveals region-specific glial activation and astrocyte shifts in epileptogenesis beyond the hippocampus. Acta Neuropathologica Communications, 2026;14:38. DOI
- Tragin M, et al. Muscle Spatial Transcriptomic Reveals Heterogeneous Profiles in Juvenile Dermatomyositis and Persistence of Abnormal Signature After Remission. Cells, 2025;14(12):939. Record → · PubMed
updated July 2026