RNA sequencing transformed molecular biology: measuring all the transcripts in a sample gives access, in a single experiment, to the activity of thousands of genes. But behind the generic phrase “sequencing RNA” lie two very different approaches that do not answer the same questions. Bulk RNA-seq measures an average across all the cells in a sample; single-cell RNA sequencing (scRNA-seq) measures expression cell by cell [1]. Choosing between the two, or deciding to combine them, is one of the first structuring decisions of a transcriptomics project. This article offers a clear decision framework, with no bias toward either: the right approach is not “the most recent one”, it is the one that answers your biological question.
Two ways of reading the transcriptome
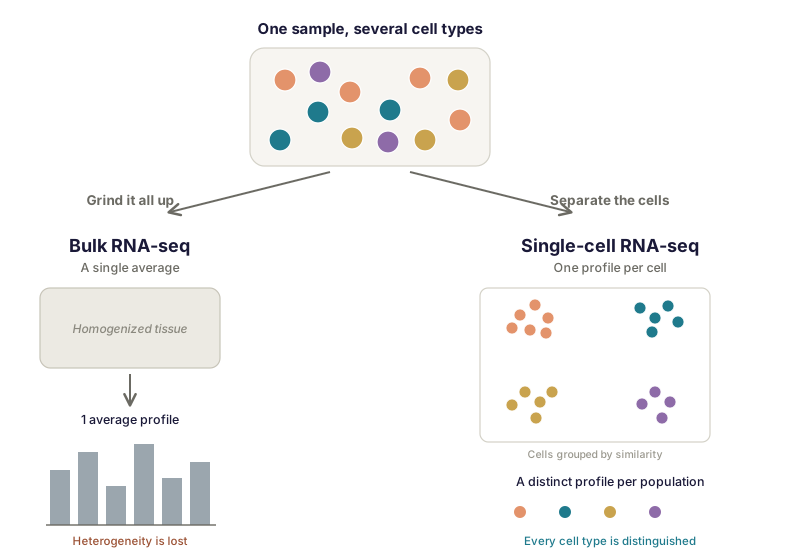
The contrast holds in a single image. Bulk RNA-seq amounts to grinding up a sample (a piece of tissue, a cell culture) and measuring the expression of each gene averaged across all the cells present. The result is one value per gene for the whole sample: robust, but global. Single-cell sequencing instead dissociates the sample into individual cells and measures expression in each cell separately. Where bulk produces one figure, single-cell produces thousands of profiles, one per cell.
A metaphor helps convey what is at stake. Bulk gives the average color of a painting: real, useful information, but it melts every brushstroke together. Single-cell restores each brushstroke separately: you finally see that the “average brown” was in fact a mixture of red, blue and yellow. Depending on the question, the average color is amply sufficient — or it masks precisely what you are looking for.
Technically, this difference in resolution is paid for from library preparation onward. Single-cell rests on two broad categories of method: droplet-based microfluidic approaches (of which the 10x Genomics Chromium platform is the most widespread), which capture thousands of cells at lower cost but mainly sequence the 3′ end of transcripts, and plate-based approaches (such as Smart-seq2), more costly per cell but offering full-length transcript coverage — useful for studying splice isoforms. A key ingredient of modern single-cell work is the use of unique molecular identifiers (UMIs): each RNA molecule is barcoded before amplification, which makes it possible to count original molecules rather than their PCR copies, and thereby to correct amplification bias.
What bulk does well, and its blind spot
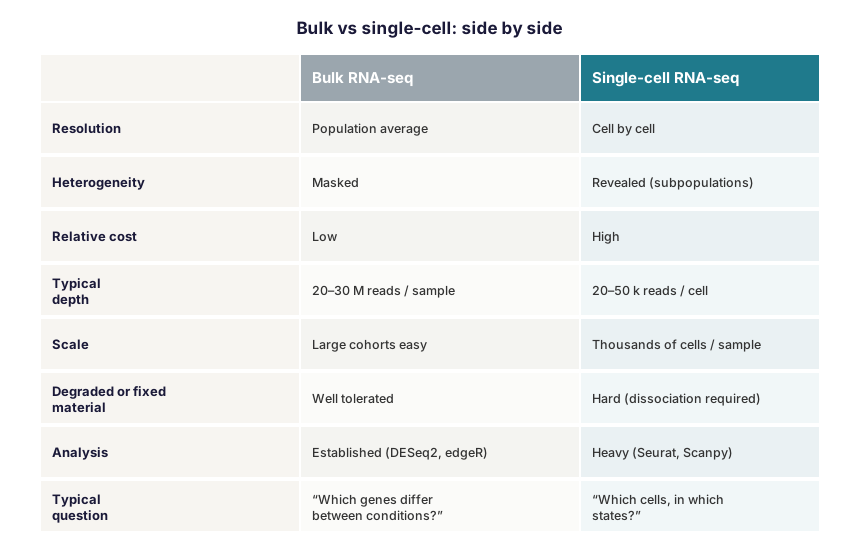
Bulk RNA-seq is a mature, robust and well-tested technique. Its strengths are real and do not disappear with the arrival of single-cell. It is relatively inexpensive, which suits large cohorts of patients or samples. It offers great sequencing depth: by pooling the signal from all cells, it quantifies expression precisely, including for genes weakly expressed within the population. In practice, a depth of 20 to 30 million reads per sample is enough for differential expression analysis in humans (ENCODE recommendations cite 30 million), bearing in mind that the gain in genes detected plateaus beyond about ten million: past that threshold, it is more profitable to increase the number of biological replicates than the depth. Bulk lends itself particularly well to classical differential analyses — comparing a treated condition with a control, identifying deregulated genes, running pathway enrichment analyses. And it tolerates degraded or fixed material better, often the only material available in a clinical setting.
Its blind spot is the direct counterpart of its strength: the average masks heterogeneity. A sample is almost never a homogeneous population of identical cells; it is a mixture of cell types, each in a particular state. Bulk adds all of that into a single profile. Two samples of very different cellular composition can therefore produce an almost identical average profile, and above all, bulk never says which cell expresses which gene. If the question concerns the composition of a tissue or the behavior of a particular cell population, the information is, by construction, out of reach.
What single-cell reveals, and what it costs
Single-cell was designed to lift exactly that blind spot. By measuring expression cell by cell, it reveals the heterogeneity hidden in a sample: it identifies the different cell types present, uncovers sometimes unsuspected subpopulations, detects rare cell states, and makes it possible to reconstruct differentiation trajectories — the order in which cells move from one state to another. Where bulk gives an average photograph, single-cell draws a detailed map of cellular diversity.
This richness has a price, literally and figuratively. Single-cell is more expensive, which limits the number of samples that can be processed; a typical experiment captures a few thousand to some tens of thousands of cells, at a depth on the order of several tens of thousands of reads per cell (10x Genomics recommends at least 50,000 read pairs per cell for gene expression). The sequencing budget also imposes a constant trade-off between depth per cell and number of cells: beyond about 15,000 reads per cell, capturing more cells is often more informative than sequencing more deeply. Single-cell also requires dissociating the tissue into isolated cells, a step that destroys spatial organization and can introduce bias — some fragile cells are lost, others react to dissociation itself; for tissues that are hard to dissociate, isolated-nucleus sequencing (snRNA-seq) is used instead. The data produced are finally more “sparse”: for each cell, many genes appear as zero because they were not captured (the dropout phenomenon), without being genuinely switched off. The volume and complexity of these data demand a markedly heavier bioinformatic pipeline than bulk.
The question that decides: what do you need?
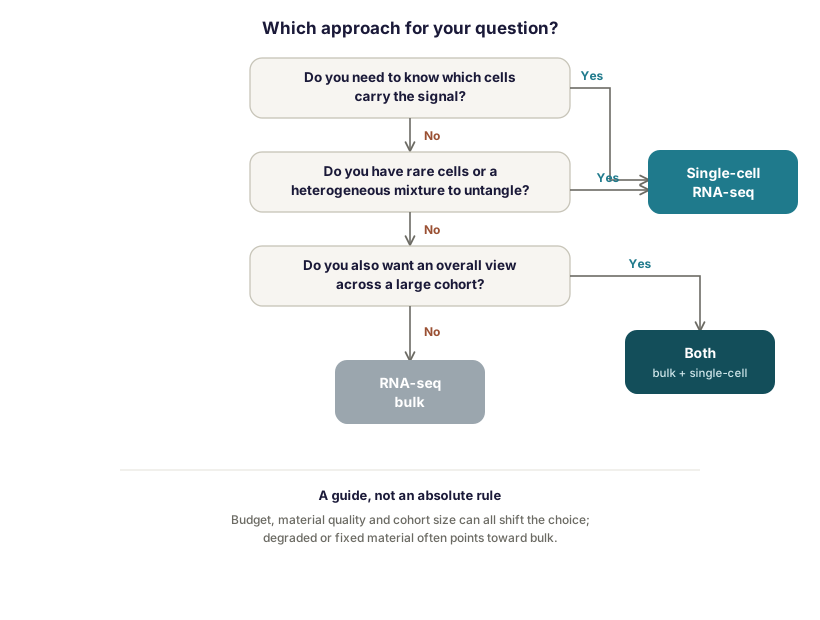
The choice does not turn on the abstract performance of a technique, but on the fit between tool and question. A few simple questions are usually enough to settle it.
First, are you looking for an overall difference between two conditions — the effect of a treatment on a tissue, say? If so, bulk is generally the right choice: robust, economical, directly suited to differential analysis. Second, are you trying to find out which cells carry a signal, or to characterize a particular subpopulation? That is single-cell territory. Third, does your sample contain rare cells or a heterogeneous mixture to be untangled? Here again single-cell is indispensable, since the bulk average would drown the rare signal. Fourth, are you constrained by budget, by the size of a large cohort, or by degraded material? These practical constraints often lead back, legitimately, to bulk.
Often the real answer is “both”
Setting the two approaches head to head is in fact a false dilemma. Depending on the question, you choose one, the other, or — increasingly often — combine them: bulk for the overall view and statistical power on large cohorts, single-cell to dissect cellular mechanisms. Three examples from work Inovarion contributed to illustrate these situations.
In a study published in the Journal of Clinical Investigation in 2024 on chronic myelomonocytic leukemia, several approaches were combined. A population of immature granulocytes, spotted by flow cytometry, proved to be an adverse prognostic factor; single-cell sequencing established that these cells belonged to the leukemic clone and described its clonal architecture, while RNA-seq, both bulk and single-cell, brought out their pro-inflammatory status and the central role of the cytokine CXCL8 [4]. The combination of methods tells a story here that none of them alone would have delivered: cytometry spots the population, single-cell places it back within the clone, sequencing sheds light on its activity.
The second example shows what single-cell alone makes visible where bulk would remain blind. In a study published in Cell in 2021 on the memory B cell response to SARS-CoV-2 infection, single-cell profiling coupled with B cell receptor (BCR) repertoire analysis made it possible to follow, over time, the maturation of individual B clones across several months [5]. This clonal dynamic — which clones emerge, mutate, persist — is by nature inaccessible to bulk, which would have delivered only a frozen average of a population in full evolution.
Between the two worlds there is finally an analytical bridge: deconvolution. From expression signatures established by single-cell, computational methods estimate the proportions of the different cell types present in a bulk sample [3] — a way of recovering part of the cellular information from less costly data, valuable for reanalyzing large existing cohorts. Certain spatial transcriptomics approaches, which preserve the location of cells within the tissue, also rest on deconvolution; Inovarion has contributed to such work, from epileptogenesis [6] to juvenile dermatomyositis [7].
The crux: bioinformatic analysis
One point is often underestimated when designing a project: in both cases, the value of the results is determined by the analysis far more than by the sequencing itself. The sequencer produces raw data; it is bioinformatic processing that turns it into biological knowledge.
For bulk, the pipeline comprises alignment or pseudo-alignment of reads (with tools such as STAR, Salmon or kallisto), expression quantification, normalization, differential analysis (typically with DESeq2 or edgeR) and functional enrichment analysis. For single-cell it is appreciably longer: generating the cell × gene matrix (with Cell Ranger for 10x data, for instance), quality control and filtering of dead cells or doublets, normalization adapted to data sparsity, dimensionality reduction (PCA then UMAP), possible integration of several datasets [2], grouping cells into populations (clustering with the Leiden or Louvain algorithms), cell type annotation, and, depending on the case, inference of differentiation trajectories — the whole orchestrated within ecosystems such as Seurat (R) or Scanpy (Python). At every step, methodological choices influence the final result. It is this dual competence, command of the bench and of computational analysis, that conditions the reliability of a transcriptomics project, and it lies at the heart of what Inovarion does.
How Inovarion can support you
Inovarion supports transcriptomics projects at every stage, beginning with the most decisive: the choice of approach suited to your question. Our teams work on bulk RNA-seq, single-cell and their spatial approaches, as well as on combining them, from experimental design through to full bioinformatic analysis. Whether the aim is to compare conditions across a cohort, to dissect the heterogeneity of a tissue, or to draw on both at once, the challenge is always the same: to match the method to the question, and to ensure the rigor of the analysis that turns it into usable data.
Publications
Field references
- Kolodziejczyk AA, Kim JK, Svensson V, Marioni JC, Teichmann SA. The technology and biology of single-cell RNA sequencing. Molecular Cell, 2015;58(4):610-620. PubMed
- Stuart T, Satija R. Integrative single-cell analysis. Nature Reviews Genetics, 2019;20(5):257-272. PubMed
- Newman AM, et al. Determining cell type abundance and expression from bulk tissues with digital cytometry. Nature Biotechnology, 2019;37(7):773-782. PubMed
Inovarion contributions
- Deschamps P, et al. CXCL8 secreted by immature granulocytes inhibits WT hematopoiesis in chronic myelomonocytic leukemia. Journal of Clinical Investigation, 2024;134(22):e180738. Record → · PubMed
- Sokal A, Chappert P, et al. Maturation and persistence of the anti-SARS-CoV-2 memory B cell response. Cell, 2021;184(5):1201-1213. Record → · PubMed
- Dufour A, et al. Spatiotemporal transcriptomic mapping reveals region-specific glial activation and astrocyte shifts in epileptogenesis beyond the hippocampus. Acta Neuropathologica Communications, 2026;14:38. DOI
- Tragin M, et al. Muscle Spatial Transcriptomic Reveals Heterogeneous Profiles in Juvenile Dermatomyositis and Persistence of Abnormal Signature After Remission. Cells, 2025;14(12):939. Record → · PubMed
updated July 2026