Crossing several layers of molecular information has become a reflex: sequence the transcriptome, profile the chromatin, quantify the proteins, phenotype by cytometry, then integrate. The question rarely asked is the one that should come first: what do we expect from that crossing?
The implicit answer is often that we expect confirmation — that the layers say the same thing, and that this concordance validates the result. It is that expectation which causes the essential to be missed. The layers do not say the same thing, they have no reason to, and it is where they diverge that the information lies. What remains is to know which kind of divergence is at hand.
This article distinguishes two regimes of disagreement with opposite consequences, offers a way to tell them apart, and illustrates integration with two studies Inovarion contributed to.
Why the layers do not say the same thing
The gap between a messenger RNA and the corresponding protein is not a measurement flaw: it is a property of living systems. Between transcription and the functional protein lie translation, degradation, post-translational modification and targeting — as many independently regulated steps, whose respective contribution to protein abundance has been extensively studied [3].
The relationship between the two levels also varies with the regime considered: it is not the same at steady state, during a lasting change of state, or during rapid adaptation. Work devoted to this question notes that studies have reached partly contradictory conclusions, and stresses the importance of distinguishing different types of correlation [1]. The reasons for concordance or disconnection are both technical and biological, and each layer constitutes a non-redundant reading of gene expression [2].
The practical consequence follows directly. Expecting the layers to confirm one another means forfeiting what each brings in its own right, and treating every gap as a problem to be fixed.
First regime: informative disagreement
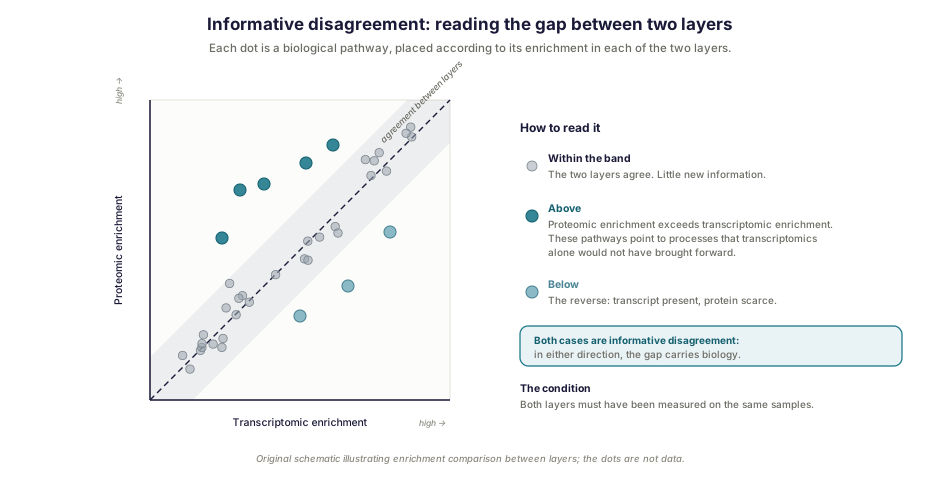
In this first regime, the gap between layers reflects a biological reality. An abundant transcript whose protein remains scarce signals post-transcriptional regulation or active degradation. The gap is not noise to be reduced: it is the result.
A proteogenomic characterization study of bladder cancer gives the clearest illustration [4]. Proteomic data were produced for 40 muscle-invasive and 23 non-muscle-invasive tumors, for which transcriptome and genome were already available. Rather than looking separately for the pathways enriched in each layer, the authors compared the enrichment obtained by proteomics with that obtained by transcriptomics, and computed the difference between the two.
The pathways whose enrichment differs most between the two layers thereby point to processes that transcriptomics alone would not have brought forward. It was the proteomic layer that revealed, in FGFR3-mutated tumors, a particular sensitivity to TRAIL-induced apoptosis — a hypothesis then tested on four cell lines carrying FGFR3 alterations, with recombinant TRAIL, a SMAC mimetic, a pan-FGFR inhibitor and FGFR3 knockdown.
The approach is instructive in itself. The therapeutic lead came neither from the proteomic layer alone nor from the transcriptomic layer alone, but from their difference. That presupposes a condition which seems obvious and is often neglected: the two layers must have been measured on the same samples.
Second regime: diagnostic disagreement
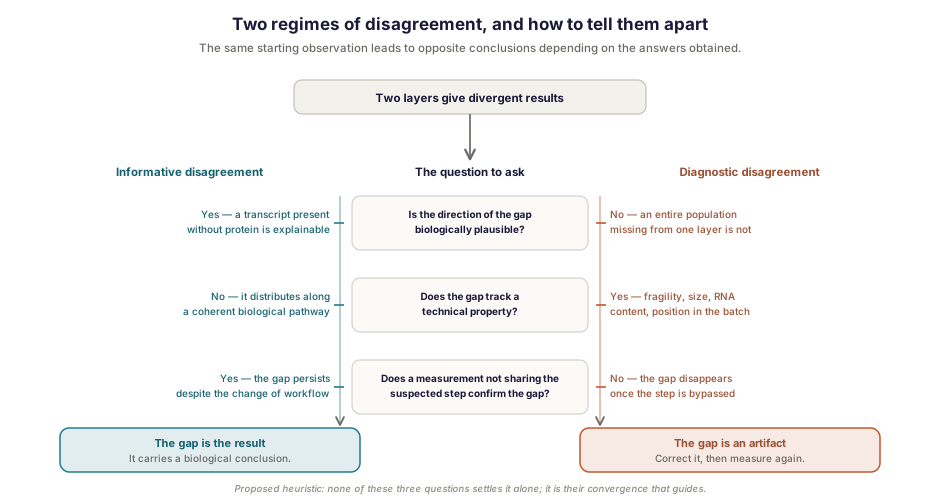
In the second regime, the layers diverge because one of them is wrong. The crossing then produces not a biological discovery but a technical diagnosis, which is just as useful, provided the two situations are not confused.
The most telling example comes from tumor immunology. Cytometry establishes that neutrophils make up 10 to 20% of leukocytes in lung tumor and adjacent tissue. Yet in droplet-based single-cell sequencing datasets these cells are practically absent [5]. The gap between the two layers is vast, and it says nothing about biology: it signals that sample preparation destroys or excludes this population, as we develop in our note on sample preparation for single-cell sequencing.
What is remarkable about this story is what came next. Having identified the artifact, the authors produced a dataset designed to capture RNA-poor cells, and analysis of those cells revealed subpopulations whose signature turned out to be associated with failure of anti-PD-L1 treatment. The diagnostic disagreement, once resolved, thus yielded a biological result — but it first had to be recognized as technical.
A rule follows, and it conditions study design: to diagnose, you need a control modality that does not share the suspected step. The precision matters, because the usual phrasing, “an independent modality”, is too vague to be useful. In the example above, cytometry and sequencing both require dissociating the tumor tissue: on that step, they do not check one another. But cytometry does not depend on the RNA content of cells and does not go through droplet encapsulation — that is, through the two mechanisms that lose the neutrophils. It could therefore reveal that particular flaw, and not just any.
How to tell which regime you are in
Three questions usually settle it, and they are better asked before interpreting.
Is the direction of the gap biologically plausible? A transcript present without the corresponding protein is readily explained. An entire population visible in one layer and absent from another is much less readily explained by biology.
Does the gap track a technical property? If it distributes according to cell fragility, size, RNA content or position in a processing batch, it is suspect. If it follows a coherent biological pathway, less so.
Is there a measurement that does not share the suspected step? This is the question that really settles matters, and it cannot be improvised: it is prepared when the study is designed, once the steps most likely to raise doubt have been identified.
Two integrations that produced a result
The two studies that follow illustrate two different ways of making layers work together.
Complementary layers
In a study of chronic myelomonocytic leukemia, each layer played a distinct role [7]. Flow cytometry identified and quantified the population of interest, immature granulocytes whose accumulation proved a powerful and independent adverse prognostic factor. Bulk and then single-cell sequencing explained what that population does: a pro-inflammatory profile, with CXCL8 as the most abundantly secreted cytokine. A functional experiment finally closed the loop, showing that CXCL8 inhibits the proliferation of healthy hematopoietic progenitors but not that of leukemic progenitors, whose CXCL8 receptors are under-expressed.
None of these layers replaced the others: identifying, explaining and demonstrating are three different operations. We return to the cytometric sorting and the sample preparation of this study in the method notes devoted to them.
Layers that answer one another
The second case follows a different logic, where two layers are read through one another [8]. In the same disease, chromatin analysis of stem and progenitor cells shows an increase in the repressive mark H3K9me2, mainly at transposable elements. The transcriptome, for its part, shows repression of immune and age-associated transcripts.
Taken separately, these two observations are mere descriptions. Set against one another, they form an argument: if increased repression of these sequences accompanies the shutdown of immune pathways, then lifting that repression should reactivate them. That is exactly what the rest of the work establishes, by combining hypomethylating agents with inhibitors of the methyltransferases responsible for the mark — with selective elimination of mutated cells and preservation of non-mutated stem cells.
The therapeutic hypothesis was contained in neither layer. It arose from setting them in relation. We develop this work in our article on chromatin mapping.
What a sound integration requires
Four requirements recur, and neglecting them produces figures rather than results.
The same samples. Crossing layers produced on different cohorts amounts to comparing populations, not levels of information. The gaps observed then confound the two sources of variation.
Batch effects, layer by layer. Each modality has its own, and they do not overlap. A variation of technical origin (sequencing depth, processing batch, operator) can reach an amplitude comparable to that of the biological signal being sought. When two layers each carry their own, the crossing risks associating artifacts rather than mechanisms.
Statistical caution. Looking for correlations among thousands of variables drawn from two layers necessarily produces some, by construction. Correction for multiple testing and a hypothesis formulated before analysis are here less refinements than conditions of validity.
Choosing the method, without the illusion of universality. Integration tools have multiplied, from classical statistical approaches to deep generative models and foundation models. A recent benchmark compared twenty-three methods across several tasks — integration accuracy, biomarker detection, trajectory inference, batch-effect correction — and concludes on task-specific trade-offs rather than a method superior in all circumstances, while noting that overall recommendations are still lacking [6]. The choice therefore follows the question, and must be justified.
That leaves the initial question, which is also the most useful: what do we expect from the crossing? Integrating because the data exist is a frequent and unproductive use. Integrating because a precise question requires it — attributing a phenotype, diagnosing an artifact, building a mechanistic hypothesis — is what separates an analysis from an illustration.
How Inovarion can support you
Inovarion supports projects drawing on several layers of information, from design to interpretation: defining the modalities useful to the question asked, articulating the experimental steps, then integrated analysis — harmonization, handling of batch effects, confronting the layers and reading the gaps. Our teams have contributed to work combining cytometry, bulk and single-cell transcriptomics, chromatin analysis and functional validation. The useful skill in these projects is less to produce more data than to know what is expected from confronting them.
Publications
Field references
- Liu Y, Beyer A, Aebersold R. On the dependency of cellular protein levels on mRNA abundance. Cell, 2016;165(3):535-550. PubMed
- Buccitelli C, Selbach M. mRNAs, proteins and the emerging principles of gene expression control. Nature Reviews Genetics, 2020. DOI
- Vogel C, Marcotte EM. Insights into the regulation of protein abundance from proteomic and transcriptomic analyses. Nature Reviews Genetics, 2012;13(4):227-232.
- Groeneveld CS, Sanchez-Quiles V, Dufour F, et al. Proteogenomic characterization of bladder cancer reveals sensitivity to apoptosis induced by tumor necrosis factor–related apoptosis-inducing ligand in FGFR3-mutated tumors. European Urology, 2024;85(5):483-494. PubMed
- Salcher S, Sturm G, Horvath L, et al. High-resolution single-cell atlas reveals diversity and plasticity of tissue-resident neutrophils in non-small cell lung cancer. Cancer Cell, 2022;40(12):1503-1520.e8. PubMed
- Wang Y, Fan Y, Wang X, et al. SCMBench: benchmarking domain-specific and foundation models for single-cell multi-omics data integration. Nature Communications, 2026.
Inovarion contributions
- Deschamps P, Wacheux M, Gosseye A, et al. CXCL8 secreted by immature granulocytes inhibits WT hematopoiesis in chronic myelomonocytic leukemia. The Journal of Clinical Investigation, 2024;134(22):e180738. Record → · DOI
- Hidaoui D, Porquet A, Chelbi R, et al. Targeting heterochromatin eliminates chronic myelomonocytic leukemia malignant stem cells through reactivation of retroelements and immune pathways. Communications Biology, 2024;7(1):1555. Record → · DOI
updated July 2026