A cytometry panel looks like a list of antibodies. It is in fact an optical trade-off, and its design determines what the experiment will be able to show, or what it will appear to show. Choosing ten markers rather than twenty, assigning a given fluorochrome to a given antibody, selecting cells or beads as controls: these decisions, taken before any handling at all, set the resolution of the populations one will then seek to distinguish.
The arrival of spectral cytometry shifted these trade-offs without abolishing them. This note sets out what really limits the number of markers, what spectral changes about that ceiling, the concrete decisions of panel design, and the pitfall specific to this technology — illustrated by two pieces of work Inovarion contributed to, which pose two opposite design problems.
What limits the number of markers
Flow cytometry measures, cell by cell, the presence of markers revealed by antibodies coupled to fluorochromes. The logic looks additive: one more antibody, one more marker.
It is not, and the reason is optical. Each fluorochrome emits not at a single wavelength but across a spectrum, and these spectra overlap. Two fluorochromes with neighboring emissions therefore produce partly conflated signals, and the limit on the number of markers is not the availability of antibodies but the capacity to separate their respective contributions.
To this is added autofluorescence: cells emit light of their own, independent of any staining, whose intensity varies with cell type and metabolic state. This background adds to the useful signal and particularly blurs the detection of weakly expressed markers.
Conventional and spectral: two ways of solving the same problem
Compensation
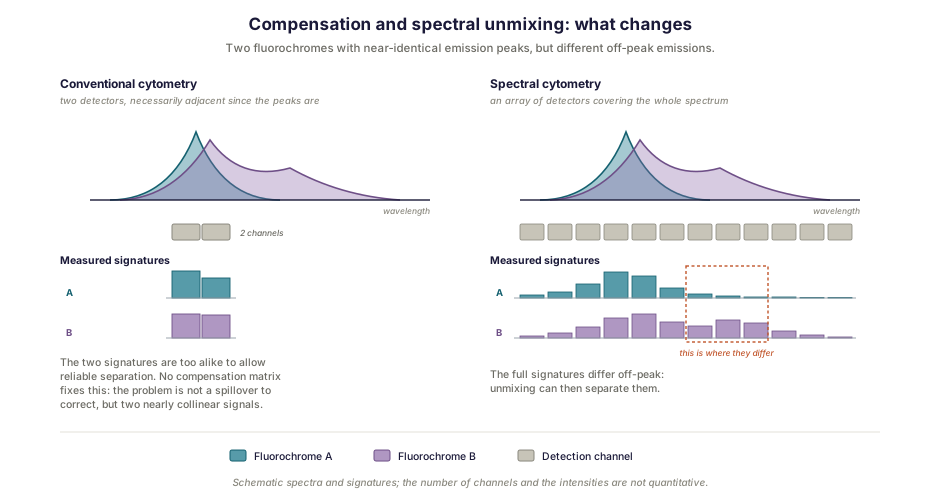
The conventional approach assigns a detector to each fluorochrome, then corrects the spillover of one onto another by means of a compensation matrix: for each pair, the fraction of signal that spills over is measured and subtracted. The procedure is well established and transparent, but it plateaus in practice, each additional fluorochrome adding spillovers to correct.
Spectral unmixing
Spectral cytometry proceeds differently. An array of detectors captures the full emission spectrum of each cell, and the composite signatures thus obtained are deconvolved by an unmixing algorithm. A decade has passed since the first commercial spectral instrument, and the gain is clear: since it is the whole signature that distinguishes a fluorochrome, dyes with close, even near-identical, emission peaks can coexist in the same panel — they are told apart by their off-peak emissions. Panels of up to fifty parameters thus become accessible [7].
This capacity has translated into published reference panels, such as a forty-color panel for deep phenotyping of the main subpopulations of human peripheral blood [5], then a fifty-color panel devoted notably to T cells and dendritic cells [6].
Spectral brings a second advantage, less often stressed: autofluorescence can be extracted from the signal. A detailed protocol for spectral panel design illustrates this point by comparing spleen and intestine samples analyzed with and without autofluorescence correction [2]. On strongly autofluorescent tissues, the benefit is considerable.
Designing the panel: the real trade-offs
Whatever the modality, design follows one and the same starting rule: begin from the biological question, not from the reagents available. A panel is built from the populations that have to be distinguished, then from the markers that define them, and only then from the fluorochromes.
Then comes prioritization. Not all markers carry the same importance or the same difficulty. Those that define the populations of interest, and above all those whose expression is weak, must receive the brightest and least spectrally crowded fluorochromes. Assigning a dull dye to a weakly expressed marker amounts to giving up in advance on seeing it.
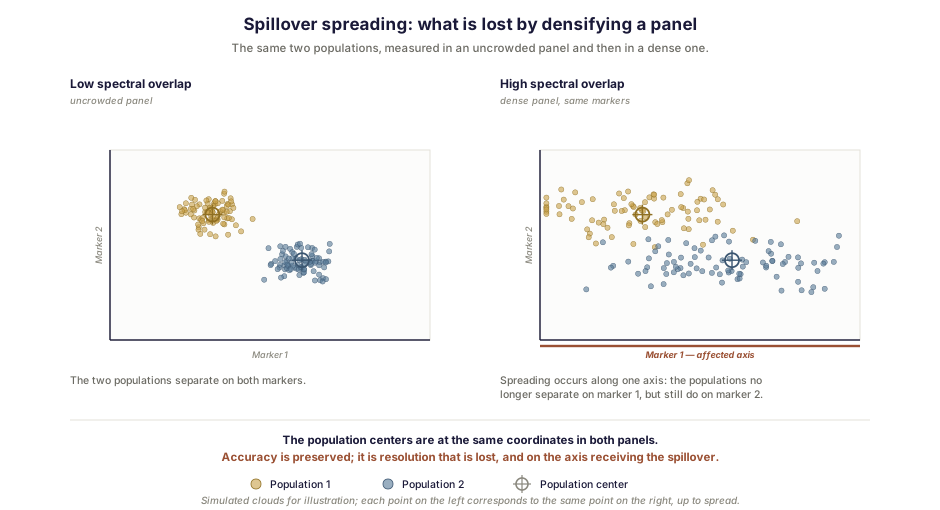
One phenomenon is counterintuitive here: spillover spreading, whose quantification has been the object of dedicated work, precisely to aid the design of multicolor panels [3]. When two fluorochromes overlap strongly, correction — whether compensation or unmixing — places the populations correctly on average, but widens the spread of the signal. The consequence is that two neighboring populations, perfectly resolved in an uncrowded panel, cease to be distinguishable in a dense one, without any calculation error having been made. It is not the accuracy of the measurement that degrades, it is the resolution, and it is lost in a directed way, along the axis receiving the spillover, while it may remain intact on another marker. Insufficient resolution moreover becomes an error of conclusion as soon as one interprets as a population what is in fact a mixture.
That leaves the controls, and on this point a practical recommendation has established itself. Single-stained controls, which supply the reference signature of each fluorochrome, gain from being prepared on cells rather than on beads, so that background autofluorescence is taken into account in the unmixing model [1]. The reference signature must correspond to that of the complete sample; failing that, unmixing relies on a model that does not describe the object being measured.
The pitfall specific to spectral
One point calls for particular vigilance, and it joins an observation we make elsewhere in relation to ChIP-seq and digital pathology: a false result can be perfectly plausible.
In conventional cytometry, poorly set compensation shows: populations tip over, stick to the axes, take manifestly aberrant positions. Spectral unmixing offers no such visual safeguard, and that follows from the way it proceeds. The algorithm solves a system from the reference signatures it is given, and it arrives at a solution even when those signatures describe the sample badly. The software does offer diagnostics (residuals, pairwise plot matrices), but one has to go and consult them: nothing comes to meet the user. An inaccurate reference model therefore does not necessarily translate into a visible aberration; it may simply shift or widen the populations.
It should be added that the problem is not only a matter of settings. The authors of a practical account of spectral cytometry, covering a twenty-one-color panel for human CD4+ T cells, note that even the best possible panel did not eliminate the overlap of secondary emission peaks or their interference in the combined spectrum; adjustments of gating and intensity then bring substantial variation in signal within the positive population itself [1]. A dense panel therefore carries an irreducible share of imperfection, which is to be known and placed where it does least harm.
From this follows a common-sense precaution: examine the pairs of markers known to be biologically independent. An unexpected correlation between two of them gains from being suspected before being interpreted.
Two cases, two design problems
Isolating a population of prognostic value
Chronic myelomonocytic leukemia is a severe myeloid malignancy with limited therapeutic options. Work Inovarion contributed to looked into the role of immature granulocytes in the progression of this disease [8]. These cells were detected and quantified in patients’ peripheral blood by spectral and conventional flow cytometry — both modalities deployed on one and the same question.
The result justifies the design effort: accumulation of these cells constitutes a powerful and independent adverse prognostic factor. The study further establishes that they belong to the leukemic clone and behave as myeloid suppressor cells; sequencing, bulk and then single-cell, reveals a pro-inflammatory profile of which CXCL8 is the most abundant cytokine, and that cytokine inhibits the proliferation of healthy hematopoietic progenitors but not that of leukemic progenitors, whose CXCL8 receptors are underexpressed.
What this case says about the panel is simple: the whole value of the result rests on the capacity to delimit cleanly one population among neighboring and partly overlapping myeloid populations. A panel that conflated them would not merely fail to see: by attributing to one the properties of a mixture, it would produce an erroneous result. The same publication is approached from its transcriptomic angle in our note on the choice between bulk and single-cell sequencing, and this disease from the chromatin angle in our article on epigenomics.
Finding a rare population
The inverse problem consists of detecting a few cells in an ocean. A second piece of work Inovarion contributed to isolated memory B lymphocytes specific for a vaccinia virus protein in people vaccinated against smallpox more than forty years earlier, and characterized a splenic CD21hi CD20hi IgG+ subpopulation [9].
The requirements are no longer the same. It is no longer a matter of separating abundant populations but of bringing an extremely rare signal out above the noise, which shifts the effort toward sensitivity, the specificity of antigenic probes and negative controls. It is worth noting that the study drew on a specialized facility, one of its authors being affiliated with the National Cytometry Platform of the Luxembourg Institute of Health. This kind of question rarely falls to a routine instrument. We develop this work at greater length in our article on B cell memory.
Before ordering the antibodies
Six checks sum up what precedes, and gain from being made in this order.
Begin from the question and the populations to be distinguished, not from the catalog. Prioritize markers according to their importance and their expression level. Assign the brightest fluorochromes to the weakest markers. Anticipate spillover spreading by avoiding placing strongly overlapping fluorochromes side by side on the decisive marker pairs. Plan single-stained controls on cells. And validate the panel on a sample whose composition is already known, before applying it to the series.
The field’s reference guidelines, whose third edition is authoritative, address these questions as well as the quality criteria expected [4].
How Inovarion can support you
Inovarion supports cytometry projects from design to interpretation: defining the panel in light of the question posed, choosing the modality — conventional or spectral — experimental implementation, defining controls, then analysis, including unsupervised analysis, and articulation of the results with transcriptomic data. Our teams have contributed to work in which cytometry made it possible to identify a population of independent prognostic value, as well as to characterize populations of extreme rarity.
Publications
Field references
- Sharma S, Boyer J, et al. A practitioner’s view of spectral flow cytometry. Nature Methods, 2024;21(5):740-743. DOI
- Ferrer-Font L, Pellefigues C, Mayer JU, Small SJ, Jaimes MC, Price KM. Panel design and optimization for high-dimensional immunophenotyping assays using spectral flow cytometry. Current Protocols in Cytometry, 2020;92(1):e70. PubMed
- Nguyen R, Perfetto S, Mahnke YD, Chattopadhyay P, Roederer M. Quantifying spillover spreading for comparing instrument performance and aiding in multicolor panel design. Cytometry Part A, 2013;83(3):306-315. DOI
- Cossarizza A, et al. Guidelines for the use of flow cytometry and cell sorting in immunological studies (third edition). European Journal of Immunology, 2021;51(12):2708-3145.
- Park LM, et al. OMIP-069: forty-color full spectrum flow cytometry panel for deep immunophenotyping of major cell subsets in human peripheral blood. Cytometry Part A, 2020;97(10):1044-1051.
- Konecny AJ, et al. OMIP-102: 50-color phenotyping of the human immune system with in-depth assessment of T cells and dendritic cells. Cytometry Part A, 2024.
- Olofsson A, Karlsson AC. Capturing the full spectrum of T cell responses with spectral flow cytometry. Oxford Open Immunology, 2026;7(1):iqaf011. DOI
Inovarion contributions
- Deschamps P, Wacheux M, Gosseye A, et al. CXCL8 secreted by immature granulocytes inhibits WT hematopoiesis in chronic myelomonocytic leukemia. The Journal of Clinical Investigation, 2024;134(22):e180738. Record → · DOI
- Chappert P, Huetz F, Espinasse MA, et al. Human anti-smallpox long-lived memory B cells are defined by dynamic interactions in the splenic niche and long-lasting germinal center imprinting. Immunity, 2022;55(10):1872-1890.e9. Record → · PubMed
updated July 2026